Cloud infrastructure and APIs are the backbone of modern business operations, crucial for delivering smooth, uninterrupted customer experiences. The applications depend heavily on APIs due to multiple integrations with various 3rd party vendors, making API performance crucial for smooth operations and customer satisfaction.
For API monitoring, one of the widely used approach is proactive API monitoring. While helpful, this approach has its downsides: it polls APIs at set intervals, adding unnecessary load, increased costs for external API calls, and doesn’t reflect the actual volume of API traffic.
To address these limitations, real-time API monitoring is also leveraged. This eliminates the need for constant polling, reducing the cost of monitoring external APIs, while accurately tracking the number of hits per API. The application now logs key metrics, and all data is then stored in OpenSearch domain’s index.
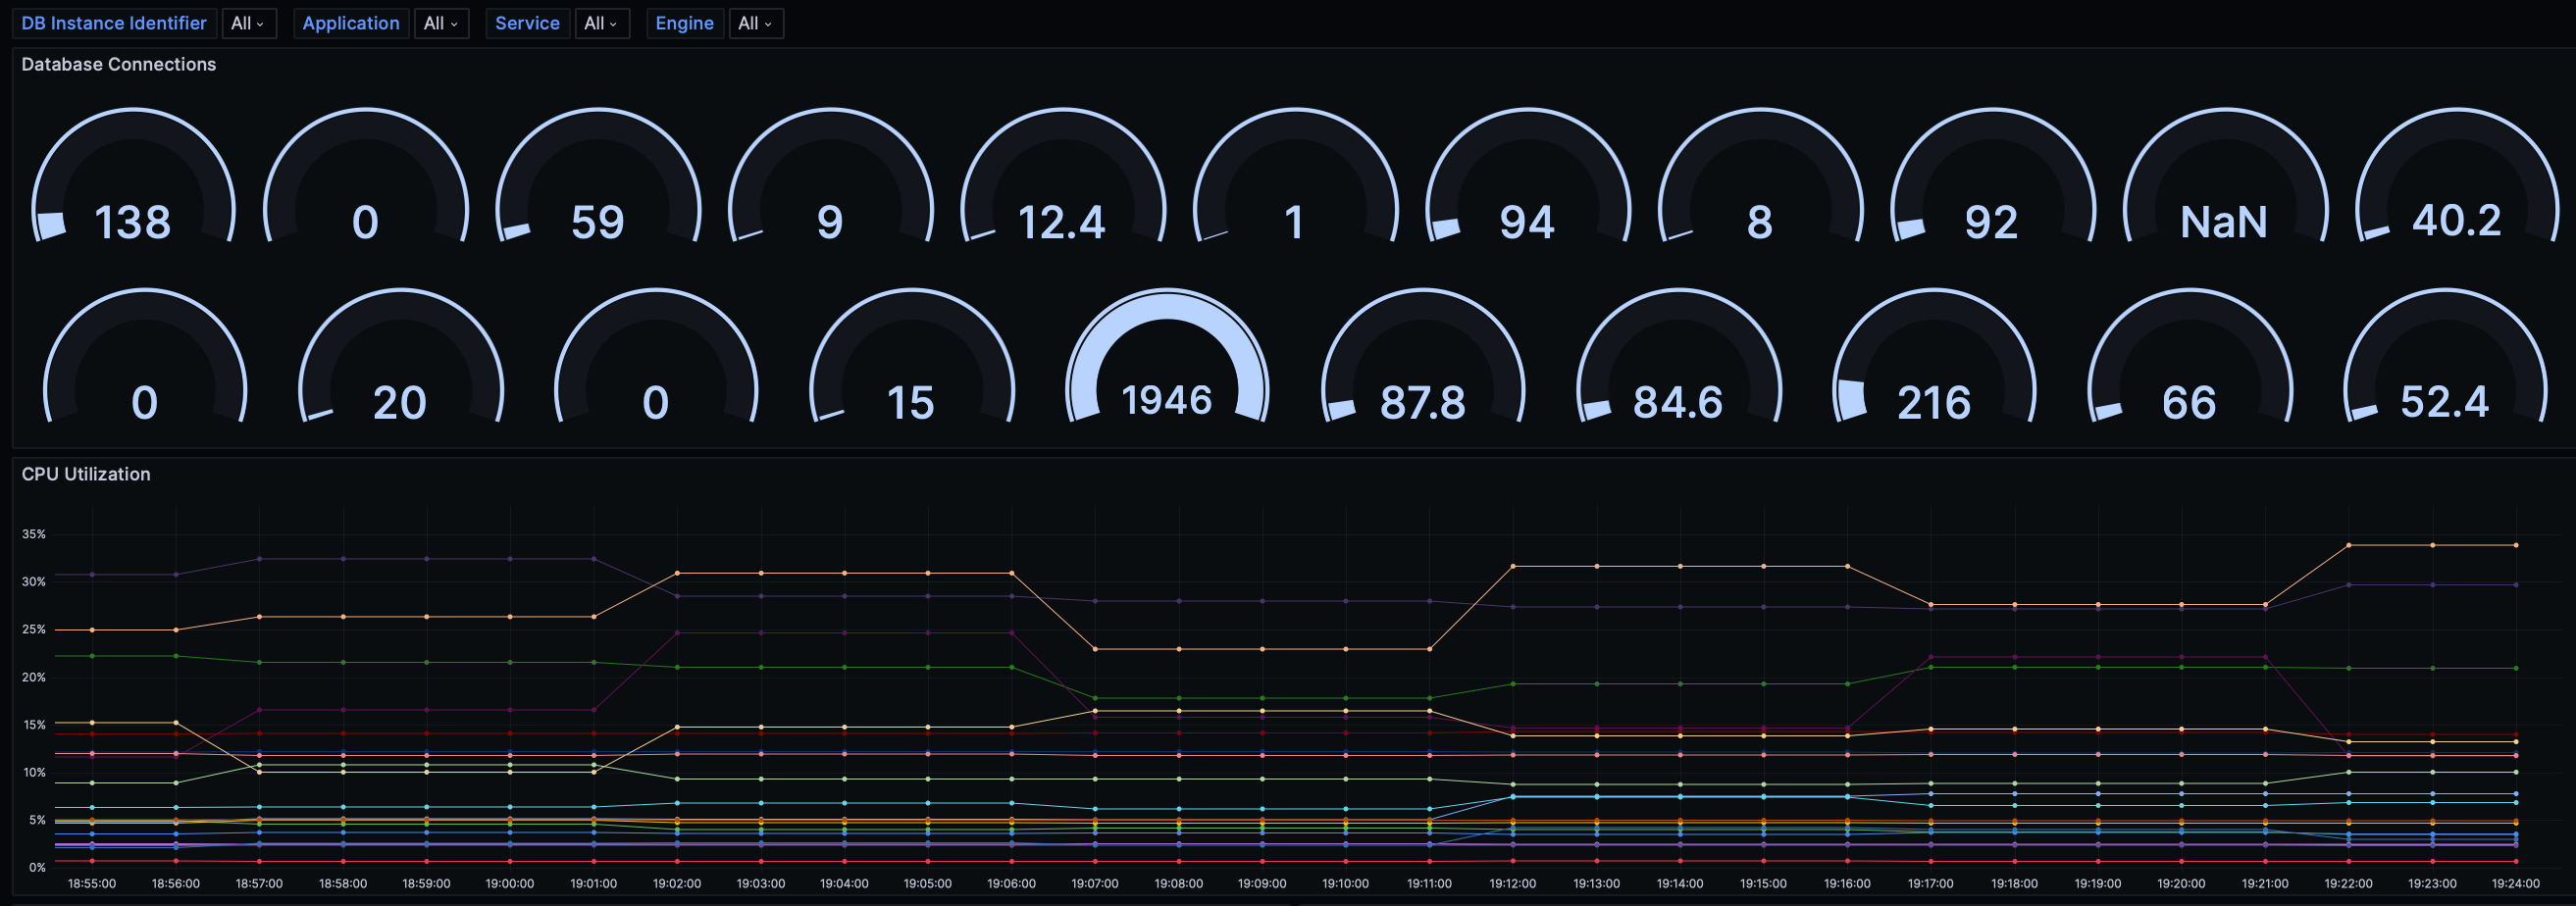
Our team deployed and configured a suite of open source monitoring tools and exporters, onto AWS EKS. Prometheus was strategically configured to scrape data from all virtual machines running our agent. In addition, it was set to capture metrics from the exporter. To optimize cost, exporter was configured to gather data from specifically tagged resources ensuring efficient yet cost-effective infrastructure monitoring.
Real-time dashboards to show important details about API performance, like the number of requests, response times, errors were configured. By using special data filters in Grafana, we made it easier to focus on the most relevant information, helping leaders make quick, informed decisions.

Database Monitoring

API Status Code
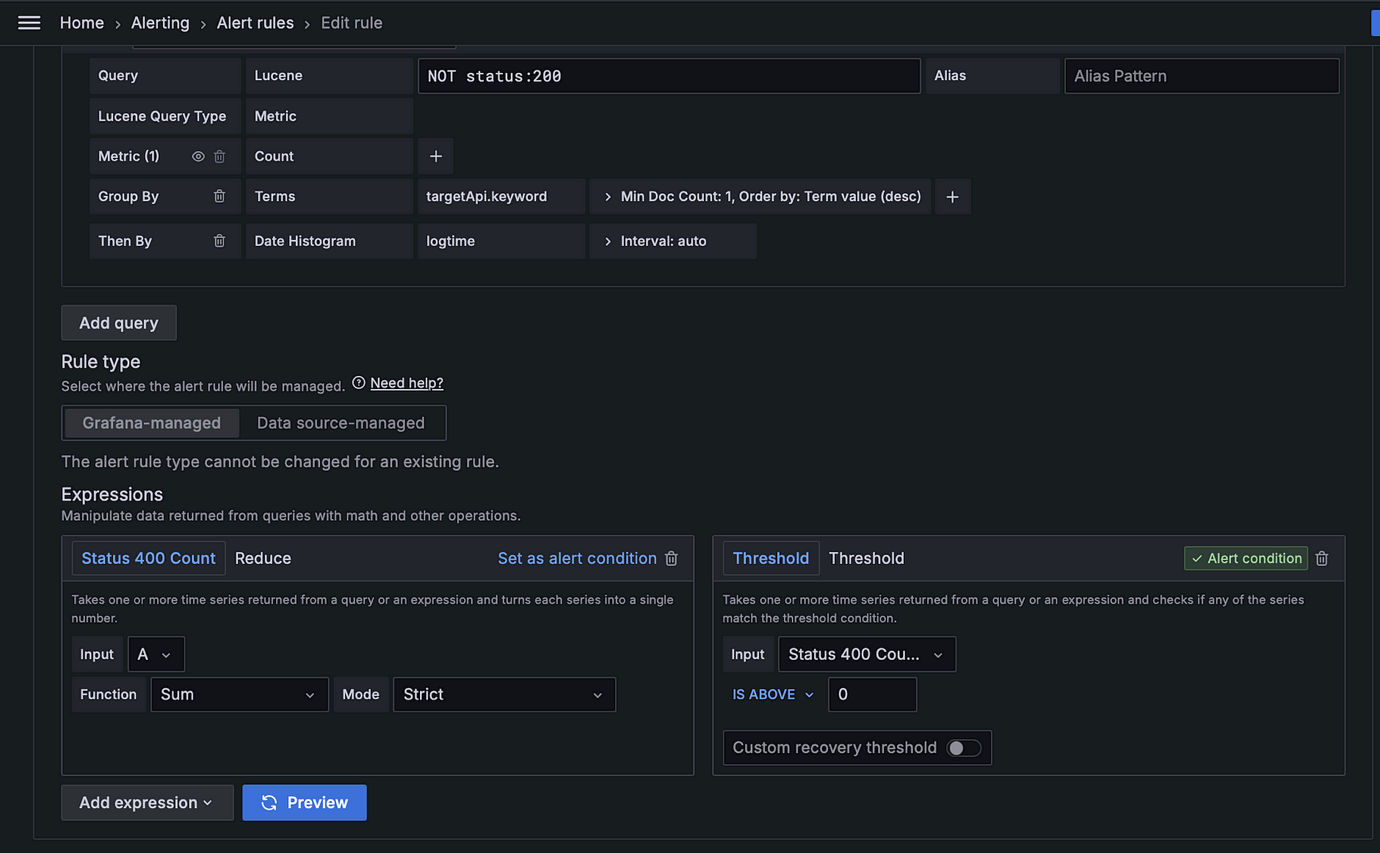
A major challenge we faced was that Grafana alerts typically rely on numeric data, while we were using JSON log data. To address this, we created a Lucene query that matched our alert conditions and organized the data by metric and timestamp. This transformed the log data into a time series format, enabling precise alerts. After setup, the alert system worked effectively, allowing us to quickly identify and resolve issues.

Alert: Status not 200
We implemented a custom Python service to manage infrastructure and API alerts. This service efficiently creates support tickets in our ITSM tool and sends real-time email and call notifications to the right stakeholders.
In conclusion, this integrated monitoring and alerting solution gives us real-time insights into API and infrastructure performance. It helps us detect and resolve issues quickly, improving our efficiency and decision-making. Ultimately, this drives business continuity and growth.


